Leaves that are green (may turn to brown)
There is strong expectation that agricultural output in India this year will be much higher than last year. The signal from the rest of the economy is rather mixed
The Indian economy is going to see green shoots this year. Literally. Thanks to good pre-monsoon showers and early monsoon, crop sowing in India is up by 27-67% compared to the five year average. Mint has a nice story (by HowIndiaLives, a database and search engine for public data) on this.
A combination of factors are behind the favourable farm conditions. Two cyclones, Amphan and Nisarga, struck on either coast in the pre-monsoon period. While they caused widespread destruction, they also brought significant rains to large swathes of India in May and early-June, paving the way for early sowing of Kharif crops. The Kharif season (June to September) sees the sowing of crops such as paddy, millets, and especially pulses, oilseeds and cotton, which are predominantly rain-fed. As of 1 July, the sowing in three of the five major Kharif crops is the highest in the last six years. For pulses, it is the second-highest sowing record over the same period.
This graph tweeted by a Mint editor along with the story nicely summarises why analysts are bullish about agricultural output this year.

Reinforcing this analysis by HowIndiaLives and Mint is data that shows that tractor sales are up in June. Mahindra & Mahindra Farm equipment reported a 12% increase in June sales compared to the same month last year. Escorts’s June tractor sales were up 23% YoY, and Sonalika Tractors sold 55% more tractors in June 2020 than they did in June 2019. The increased demand for tractors has its impact elsewhere as well - on the demand for tyres (video), for example.
While some of the increase in demand is on account of pent up demand from a rather harsh national lockdown in April and May, the increase in tractor sales also point to improved farmer sentiment that again points to improved agricultural production this year.
And as if to complete a trifecta of data points, sales of Di-Ammonium Phosphate (DAP), a fertiliser, have improved substantially. April sales were 72% higher than last year, while May’s sales rose by over 100%.
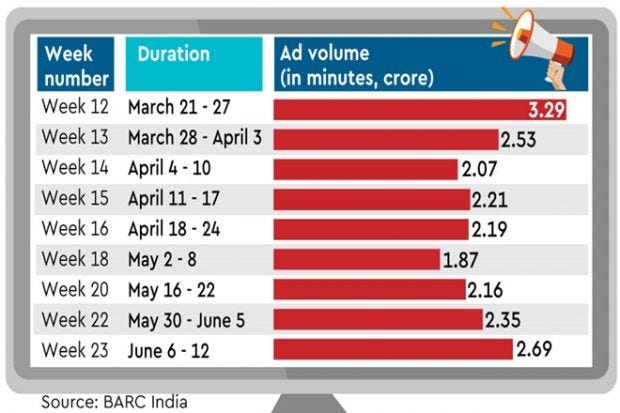
Moving beyond agriculture, other kinds of shoots are also seen. Shoots of television serials and sitcoms have restarted after they had been mandated to shut down during the lockdown. Television channels in India had faced a double whammy during the lockdown, having run out of fresh inventory on their ongoing programs, and also seeing slowing advertiser demand. Coinciding with the restart of shooting and the airing of new episodes, advertisers are also coming back to television.
Data from BARC (Broadcast Audience Research Council; see image below, reproduced from the Financial Express) show that advertising volume on television is back to the levels that we were seeing at the beginning of the lockdown.

However, we need to point out that this doesn’t necessarily mean that advertising revenues of television channels are back to normal. That volumes are back simply means that demand for TV spots is barely sufficient now to cover the supply. Whether there is competitive bidding for spots, and whether channels are making any money beyond their reserve prices, cannot be inferred from this data.
Mixed Signals In Employment, Energy and Elsewhere
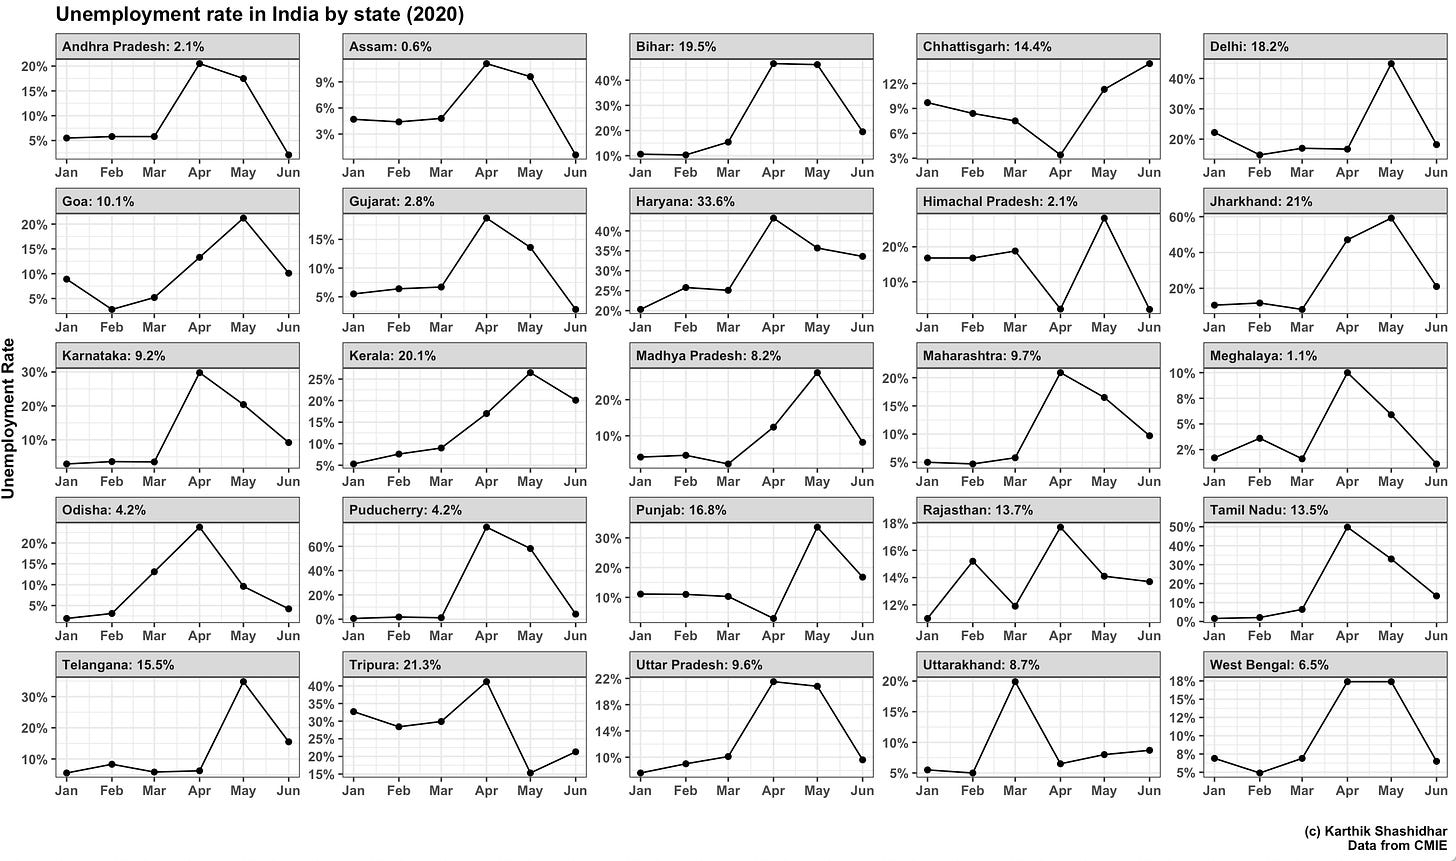
The signal from the rest of the economy is mixed. As we had written a couple of weeks back, the job situation is much better than it was in May, with unemployment rates down to 9% now compared to 24% in April and May.

There is, as we might expect, a massive divergence in unemployment recovery across states. Andhra Pradesh, Gujarat and West Bengal are back to unemployment levels that they saw before the pandemic hit. On the other hand, while states such as Kerala and Punjab have recovered, their unemployment rates are far higher compared to before the pandemic (once again, it is worth remembering that these numbers are based on surveys from CMIE, a private agency, and are not official government numbers).
Data, and maybe reporting, regarding energy products is rather interesting, to say the least. Firstly, sales of petroleum products in June were 88% of that of last year. An article in Mint has termed this as a “sharp recovery”, and stresses in the headline that this demand is “reaching pre lockdown levels”.
Then, demand for electricity in June this year was 90% of what it was last year (106 billion units compared to 117 billion units). A story in the Financial Express that covers this shows this as an example of “economic activity being dull”.
What we can somewhat confidently say from these data points is that economic activity in India in June 2020 was 10-12% below June 2019. Whether you look at this as “almost back to pre-lockdown” or “economic activity being dull” is a philosophical matter and outside the scope of this newsletter.
14 “official” indicators
Nothing, however, is outside the scope of the government. The Finance Ministry has listed 14 indicators which are together supposed to tell us how the economy is doing. Based on these indicators, the government has said that “early green shoots of revival have emerged in agriculture, manufacturing and services sectors”. What is left?
In any case, the Economic Times article that covers these indicators does a great job of looking at some of these indicators and dissecting whether the green shoots are real, or if they may turn to brown.
The indicators that the government is using to determine whether the economy is back to normal doesn’t include data from the world’s biggest search engine. Google, which tracks movements of owners of Android phones (whether they like it or not), sometimes decides to put the enormous data it collects to “good use”.
So now they are releasing “mobility reports”, maybe to generate some goodwill in exchange for all the bad press they get on account of data collection without permission.
Mint has some good analysis of these mobility reports for India, and frankly, there is no real surprise in the findings. This graphic sums it up.

So are there really green shoots? In agriculture, there appear to be. The automobile sector is picking up, though supply issues remain (paywalled). Retail sales are down 67% compared to last year, and malls 77%. However, 90% energy consumption in June compared to last year isn’t bad. And as we said earlier, whether this represents “almost back to normal” or “definite recession” is out of the scope of this newsletter.
There is one thing we need to keep in mind, however - a lot of the data collected by articles we have surveyed are related to large size firms, and small and medium firms may not have had the same sort of experience. We will leave you with this blog post by V Anantha Nageswaran, a part-time member of the Prime Minister’s Economic Advisory Council.
What this shows is that when shocks affect all sectors equally, then the approximation mechanisms and formulae adopted by statistical agencies (for example, using growth or contraction in the formal sector to gauge the fluctuations in activity in the informal sector) do hold. However, when the shock is idiosyncratic (that is, it affects only one sector – like demonetisation did – for the informal sector that is largely or fully cash-based), then the approximation mechanisms break down and they end up giving misleading results.
That is what happened with the real GDP growth estimation in 2016-17. In a way, the statistical system ends up doing a big disservice to policymakers, for it sends the wrong signal about the health and dynamism of the economy.


